Sourced
Every level in the header strip and in each brief comes from the primary publisher, with the release date. If a number cannot be traced to a publisher page, it does not appear.
MacroLens maps eleven Sri Lankan macro indicators onto twelve CSE sectors: direction, magnitude, and the lag before it reaches the income statement. Built for investors who want the operating driver before the quarterly filing tells them.
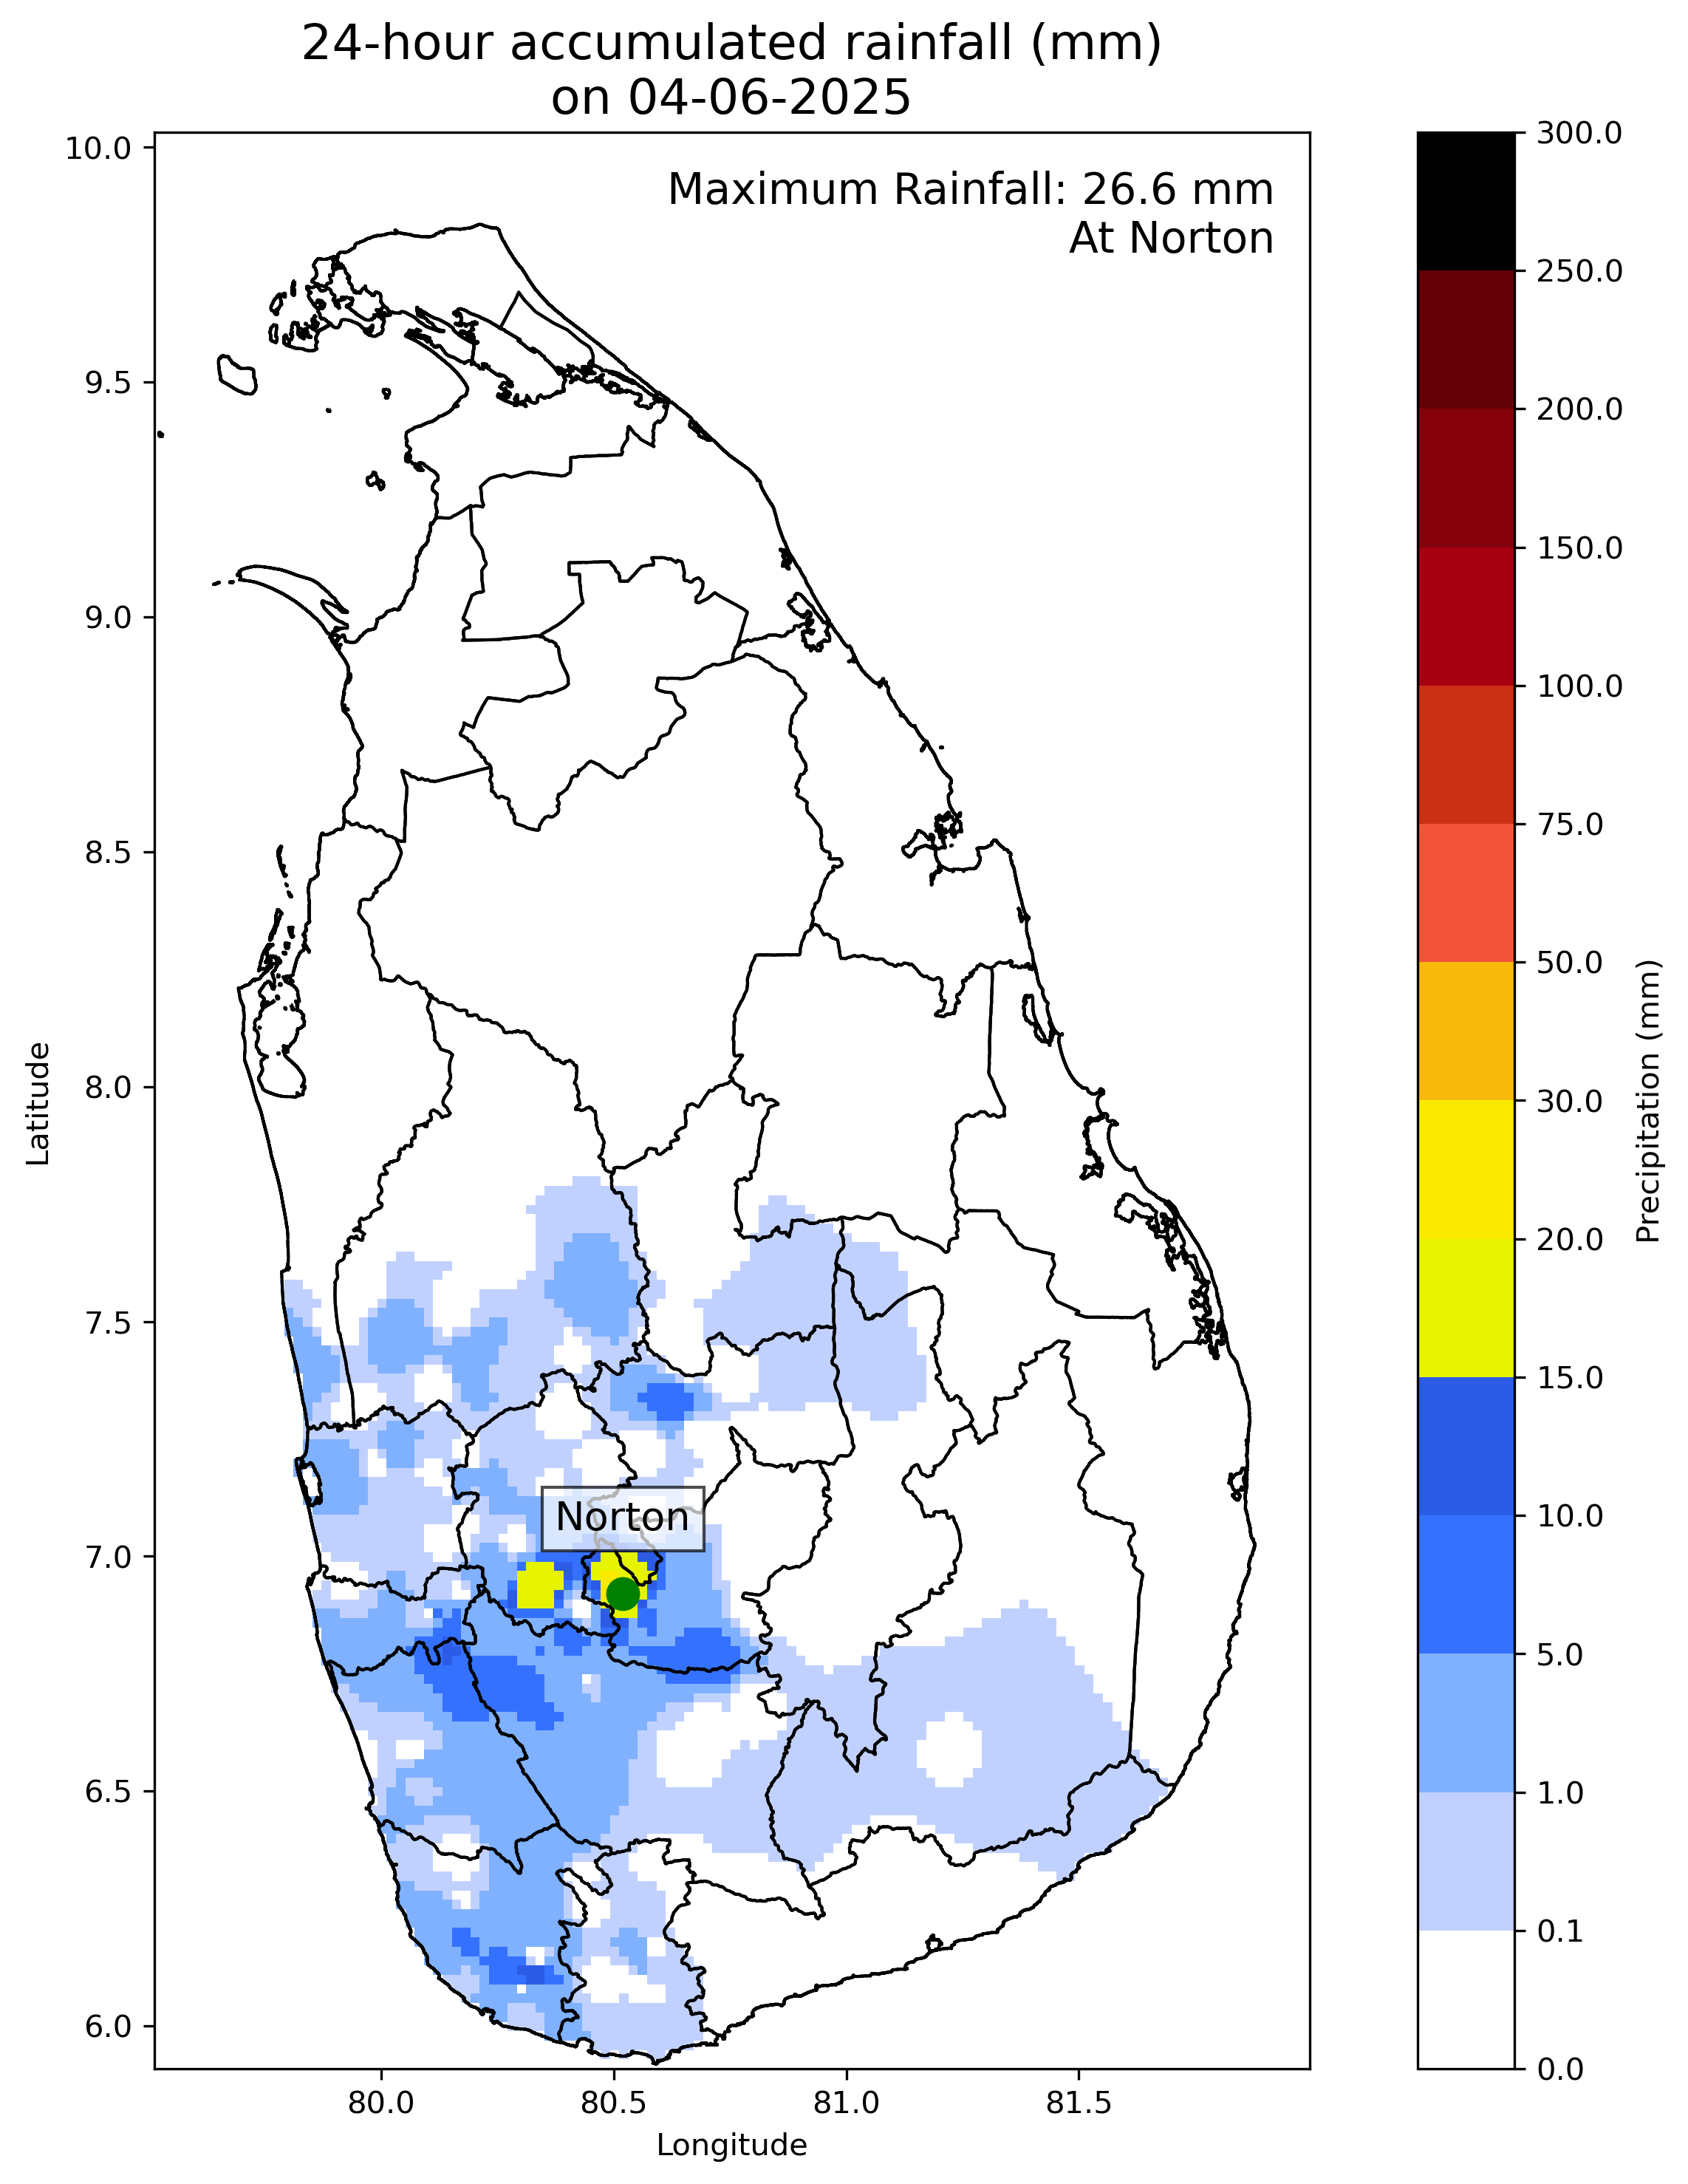
The part of the model that moves every day. A GDP nowcast and a rupee-pressure gauge built from dated inputs, port traffic off the SLPA berthing programme, the rupee and bullion off live feeds, the week’s T-bill auction, commodity and reservoir boards, the Met Department’s rainfall map, and the dated events wire - each block carries its publisher and the moment the data was issued. A block that cannot show where its number came from does not ship.
| Input | Latest reading | As of | pp |
|---|---|---|---|
| Private-sector credit | +27.8% y/y, Rs 11.04tn outstanding | MAY 26 | +0.5 |
| Import demand | fuel imports +40.2% y/y; trade gap widening | JUN 26 | +0.3 |
| Electricity generation | 4,578 GWh planned Q2, +1.1% vs Q2-25 | Q2 26 | +0.1 |
| Tourist arrivals | 196,845 in Jul, -1.7% y/y | JUL 26 | -0.2 |
| Policy tightening drag | +100bp May hike still feeding through | MAY 26 | -0.3 |
| Net adjustment to anchor | +0.4 | ||
| ETA | Vessel | TEU | LOA | Service |
|---|---|---|---|---|
| 31 Aug 12:00 | MSC LORETTA | 2,703 | 304M | ING-W |
| 01 Sep 16:00 | NORTHERN PRACTICE | 1,100 | 265M | AGI W/B |
| 01 Sep 23:00 | MSC MAKOTO II | 376 | 176M | HAL |
| 02 Sep 05:00 | MSC KETA II | 656 | 196M | KERALA SHUTTLE |
| 02 Sep 07:00 | MSC ROMANE | 1,338 | 300M | NWC TO IPAK |
| 02 Sep 08:00 | MSC EYRA 11 | 1,386 | 176M | ADHOC |
| 02 Sep 08:00 | CMA CGM NERVAL | 750 | 300M | KILIMA E/B |
| 02 Sep 12:00 | ASL PEONY | 470 | 172M | TEX |
| 02 Sep 12:00 | CELESTIA | 600 | 143M | MALE |
| 02 Sep 15:00 | MSC KANU F | 600 | 159M | TUT |
| 02 Sep 17:00 | LILA MOMBASA | 1,500 | 192M | MLEFE |
| 02 Sep 23:00 | CMA CGM CORTE REAL | 1,500 | 366M | WAX |
| 03 Sep 09:00 | MSC APOLLO | 2,800 | 300M | ADHOC |
| 03 Sep 12:00 | MSC CLEMENTINA F | 500 | 148M | ADHOC |
Sri Lanka publishes no streaming macro API, and the CSE exposes no public quote feed. So the desk is honest about cadence: the rupee board refreshes live in your browser, the port board is restated whenever the SLPA programme changes, and policy, prices and arrivals move on their publishers’ calendars. The freshness tag on each block tells you which is which - and the AIS map below is genuinely live. The nowcast, the rupee gauge and the desk read are models built on these dated inputs, and are labelled as such.
| Sector | Jul 2026 earnings | y/y | Share of Jul exports | People it carries |
|---|---|---|---|---|
| Apparel & textiles | $437.6m | -8.8% | 34.0% of merch | 350,000 direct jobs, ~1m incl. indirect; ~6% of GDP (JAAF) |
| ICT/BPM (services) | $143.2m | n/a | 40.7% of services | 115,000+ direct jobs (SLASSCOM, 2024) |
| Tea | $116.7m | -17.2% | 9.1% of merch | ~2m livelihoods, 10% of the population (Tea Board, 2024) |
| Rubber products | $87.2m | +3.2% | 6.8% of merch | 300,000+ direct & indirect jobs; 2025 exports $915m (EDB, Jan 2026) |
| Electrical & electronics | $76.3m | +99.7% | 5.9% of merch | wire & cable exports +150% y/y in Jul |
| Spices & concentrates | $72.1m | +96.0% | 5.6% of merch | cinnamon alone: ~70,000 smallholders, 30,000 peelers (STDF master plan) |
| Coconut & kernel | $24.3m¹ | +26.7% | 1.9% of merch | sector exports $855m in 2024; roadmap targets $1.5bn by 2030 (CRI, 2026) |
A CSE quarterly lands roughly 45 days after the quarter closes. By then the policy rate, the rupee and the arrivals number have already decided most of the revenue line. The gap between the macro print and the filing is the only window where the information is still worth something.
Private-sector credit accelerates in month zero. It shows up in bank net interest income two to three quarters later. Everyone reads the same CBSL release; almost nobody carries it forward to a revenue number by ticker.
"A weaker rupee hurts importers" is a slogan. What a desk needs is the sign, the elasticity, the pass-through window, and which line of the P&L absorbs it: volume, price, margin, or funding cost.
The same 100bp of tightening expands a bank's margin, squeezes a leasing book, defers a construction order, and barely touches a tea exporter. Sector-blind macro commentary averages all of that into noise.
Eleven indicators, twelve sectors, 132 links. Each cell carries a sign, a first-order sensitivity, a transmission lag, and the P&L line that absorbs it. Click a cell for the summary, then open the full working: the mechanism in plain English, the arithmetic behind the number, the source reading with its publisher and date, why the lag is what it is, and the counter-argument that would break it.
Move the indicators. The model runs the matrix and returns an estimated twelve-month revenue impact by sector, ranked. Start from a preset or build your own macro path.
Coverage follows the CSE's listed universe. For every sector we track the two or three leading indicators that actually set the revenue line, and the reporting lag between the indicator and the filing.
A relationship map of the CSE's 28 largest listed companies, built the way an institutional terminal draws it. Put any heavyweight in the centre; the ring shows the companies that share its revenue line, sized by market capitalisation, priced at the last close, and connected by quantified relationships: trailing revenue and relative size. The dossier shows which macro indicators move the whole ring. Prices are the CSE trade summary for Tuesday 25 August 2026; market caps and trailing revenue are August 2026 figures.
Not a newsletter. A maintained model, an alert layer on the release calendar, and the underlying data in a form you can put in your own spreadsheet. One subscription covers the whole terminal: three days free, then LKR 5,000 a month - or LKR 25,000 a month for a team of up to 10.
Every indicator released that week, what it changed in the matrix, and the three sectors where the revised path matters most. Two pages, Monday morning, before the market opens.
CBSL policy reviews, CCPI and NCPI prints, SLTDA arrivals, weekly tea auction averages, monthly external-sector data. You get the number and the re-run scenario within the hour, not the next morning.
Full elasticity matrix, sector mappings, and indicator history, in the open. Fork the priors, argue with them, run your own scenario.
Two things are kept strictly apart. Indicator levels are sourced from primary publishers and dated. Elasticities are analyst priors: transparent, arguable, and clearly labelled as estimates.
Every level in the header strip and in each brief comes from the primary publisher, with the release date. If a number cannot be traced to a publisher page, it does not appear.
Sensitivities and lags are set by analyst judgement anchored on published sector accounts and historical episodes. They are priors, not fitted coefficients, and every scenario output inherits that caveat.
Matrix revisions are dated and changelogged. When a prior moves, the changelog records the old value, the new value, and the reason it changed.
The site is not a live feed. Each series is refreshed when its publisher releases: CCPI monthly on the last working day, arrivals monthly, the tea average in the first week, banking-sector data quarterly, the policy rate on eight review dates a year. Between releases nothing changes, and the date on every reading tells you when it last did.
Monetary policy review 30 September 2026. CCPI at each month end. SLTDA arrivals in the first fortnight of the following month. The Colombo auction runs weekly; the national average is published monthly.
When a reading is replaced or a prior is revised, the old value, the new value and the reason are recorded. Sensitivities do not move quietly.